How to Read Forex Charts: Candlestick Patterns Every Beginner Should Know
- Primary Signal: How to Read Forex Charts: Candlestick Patterns Every Beginner Should Know
- Overview: A candlestick chart looks like a wall of coloured bars, but each candle tells a small story about buyers and sellers. Learn to read individual candles and the handful of patterns t...
- Verification: Analyzed and compiled by 1UpTrade Live editorial monitoring desk.
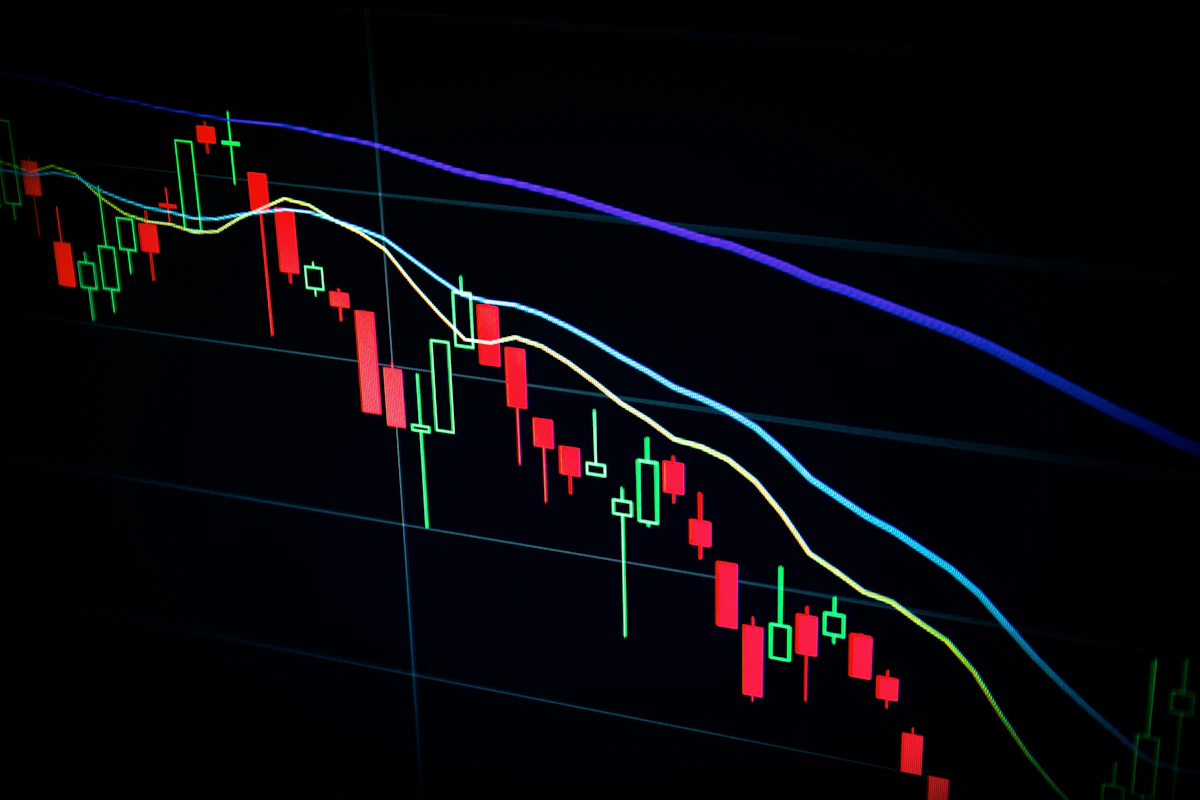
Open a forex chart for the first time and you will see a forest of red and green rectangles with thin lines sticking out of them. Those rectangles are candlesticks, and each one compresses everything that happened to a currency pair during one period into a single shape: where the price opened, where it closed, and how far it travelled in both directions. Learning to read candles is the first real skill in technical analysis, because every indicator and every strategy is built on top of the price action they show.
What a Single Candlestick Tells You
Every candlestick has four prices: open, high, low and close. The thick part, called the body, runs from the open to the close. A green or white body means the price closed higher than it opened, so buyers won that period; a red or black body means sellers won. The thin lines above and below the body are the wicks or shadows, and they show how far price travelled before being pushed back. A long upper wick means buyers pushed the price up but could not hold it there, which is useful information even if the candle closed green.
The size of the body matters as much as its colour. A long body shows a strong, decisive move in one direction, while a tiny body shows indecision: buyers and sellers fought to a draw. A candle with almost no body at all is called a doji, and it often appears at turning points, where the market pauses before choosing a direction. Do not overread a single doji, but do pay attention when one appears after a long run in one direction.
The Patterns Beginners Should Learn First
Start with just three patterns. The hammer is a candle with a small body at the top and a long lower wick, appearing after a fall; it shows sellers pushed the price down and buyers fought it all the way back, which is often the first sign of a bounce. The shooting star is the mirror image at the top of a rise, with a long upper wick showing buyers failed to hold higher prices. The engulfing pattern is two candles where the second body completely covers the first, signalling that the other side has taken control.
These three patterns cover most of what a beginner needs, because they appear constantly on every pair and timeframe. Learn to spot them on the daily chart first, where they are most reliable, before hunting for them on five-minute charts. A hammer on the daily chart has real weight behind it; a hammer on the one-minute chart is usually noise.
Candlesticks in Context: Trend and Location
A candlestick pattern is only as good as where it appears. A hammer in the middle of a choppy range means almost nothing, because there is no trend for it to reverse. The same hammer at a strong support level, after a clear downtrend, is a genuinely interesting signal. Location is what turns a pattern from a curiosity into a trade idea, so always check two things before acting on any pattern: is there a trend, and is the candle sitting at a level that matters?
Timeframe adds a second layer of context. A pattern that appears on both the four-hour and daily charts at the same level is far stronger than one visible on a single timeframe, because traders on different horizons are all seeing the same signal. When in doubt, step up to the higher timeframe. If the pattern disappears there, it was probably noise.
Common Mistakes When Reading Charts
The biggest mistake is trading every pattern you see. Candlestick patterns have a modest edge at best, and trading them blindly will produce a string of small losses that slowly drain an account. Use patterns as confirmation for an idea you already have, such as a level or a trend, rather than as a standalone reason to trade. A pattern that agrees with your analysis is useful; a pattern that is your only reason is a gamble.
Another mistake is ignoring the trend. Buying every hammer in a strong downtrend is how beginners catch falling knives: one hammer bounces, the next three fail, and the account is smaller by the end of the week. Patterns work best with the trend, not against it, and they work worst of all in the hour before major news, when price can ignore every pattern on the chart. Learn the shapes, respect the context, and let the chart confirm your plan instead of making it for you. This article is educational only and is not financial advice. Trading forex carries a high risk of loss; never trade with money you cannot afford to lose.
More from 1UpTrade Live