How to Read Candlestick Patterns in Forex: A Beginner's Guide
- Primary Signal: How to Read Candlestick Patterns in Forex: A Beginner's Guide
- Overview: Candlesticks tell you who is winning the battle between buyers and sellers. This beginner's guide explains how to read candlestick patterns in forex, from single candles to the rev...
- Verification: Analyzed and compiled by 1UpTrade Live editorial monitoring desk.
Open any forex chart and you will see candlesticks: small coloured bars that show how price moved during a set period. Each candle tells a short story about buyers and sellers, and when you learn to read them, the chart stops looking like random noise and starts looking like a conversation you can follow.
This guide explains how to read candlestick patterns in forex from the ground up. You do not need to memorise fifty patterns. A handful of reliable ones, used in the right context, will cover almost everything a beginner needs.
Candlestick Anatomy: Body, Wicks, and Colour
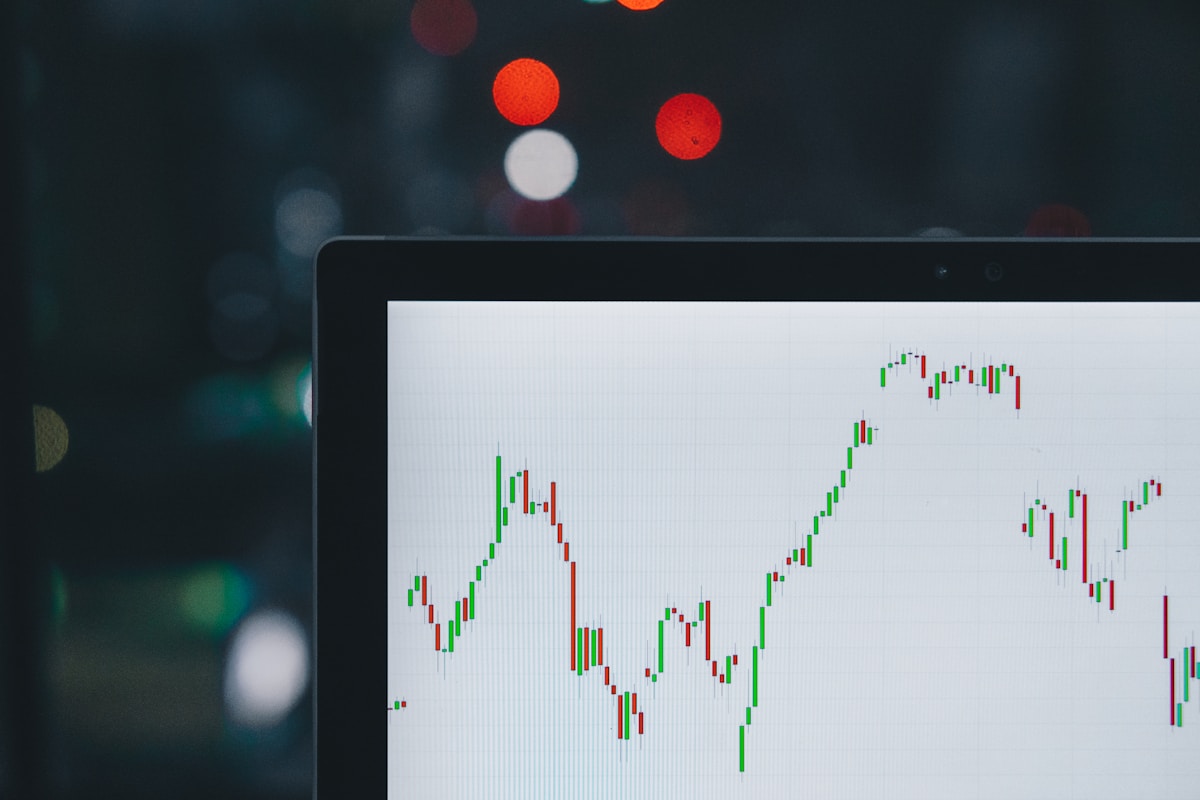
Every candlestick has four prices: open, high, low, and close. The thick part, called the body, runs from the open to the close. The thin lines above and below, called wicks or shadows, show the highest and lowest prices reached during that period. A long body means strong movement in one direction; a long wick means price was pushed far in one direction and then rejected.
Colour tells you the direction. On most charts, a green or white candle closed higher than it opened, meaning buyers won that period. A red or black candle closed lower than it opened, meaning sellers won. The size of the body relative to the wicks is often more informative than the colour alone — a candle with a tiny body and long wicks is telling you the market is undecided.
Single Candles Every Beginner Should Know
The doji is the most famous indecision candle: open and close are almost identical, leaving a tiny body with wicks on both sides. A doji at the top of an uptrend suggests buyers are running out of strength, while a doji at the bottom of a downtrend suggests sellers are tiring. Alone it is only a warning, but it is a useful one.
The hammer has a small body at the top and a long lower wick, like a hammer shape, and it appears after a downtrend. It shows sellers pushed price down but buyers fought it back up before the close — a possible reversal signal. Its opposite, the shooting star, has a long upper wick after an uptrend and warns that buyers were rejected. The marubozu, a candle with almost no wicks, shows one side in total control.
The Most Reliable Reversal Patterns
The engulfing pattern is two candles: the second candle's body completely covers the first. A bullish engulfing at the bottom of a downtrend, where a large green candle swallows a small red one, is one of the strongest reversal signals in forex. A bearish engulfing at the top works the same way in reverse, and both are more reliable on higher timeframes like the four-hour and daily charts.
The morning star and evening star are three-candle patterns that signal a trend change with a small indecision candle in the middle. They are less common but very reliable when they appear at a key support or resistance level. The three white soldiers and three black crows, three strong candles in a row, signal that a new trend may be gathering strength rather than reversing.
Context Matters More Than the Pattern
A hammer in the middle of a sideways range means almost nothing, while the same hammer at a major support level after a long downtrend means a great deal. Always read candlesticks in context: what is the trend, where are the nearest support and resistance levels, and is the pattern forming at a level that matters? A pattern that agrees with the bigger picture is worth ten patterns that fight it.
Volume and timeframe also matter. A pattern on the daily chart carries far more weight than the same pattern on the one-minute chart, where noise creates false signals constantly. Beginners should learn candlesticks on the one-hour and four-hour charts first, where patterns are cleaner and more trustworthy.
How to Practise Reading Candlesticks
Start by marking just three patterns on your charts for two weeks: doji, hammer, and engulfing. Note where they appear, what happens next, and whether the context supported the signal. You will quickly learn which ones work on your pairs and which ones fail, and that personal evidence beats any textbook list.
Combine candlesticks with one other tool, such as a moving average or a support level, rather than trading patterns alone. A bullish engulfing candle bouncing off a rising moving average is a far stronger trade than the same candle floating in empty space. Master a few patterns deeply, use them in context, and your chart reading will improve faster than any indicator ever could.
More from 1UpTrade Live