Bollinger Bands in Forex: Squeeze, Bounce and Breakout Explained
- Primary Signal: Bollinger Bands in Forex: Squeeze, Bounce and Breakout Explained
- Overview: Bollinger Bands show how volatile the market is right now and where price is stretched too far. This guide explains the squeeze, the bounce and the breakout, and how to trade each ...
- Verification: Analyzed and compiled by 1UpTrade Live editorial monitoring desk.
Bollinger Bands are one of the most visual indicators in forex, and once you understand them, you can read a chart's mood at a glance. The bands expand when the market is volatile and contract when it goes quiet, which makes them useful for spotting both calm periods before a big move and stretched prices that may snap back. But they are also easy to misuse. The most common error is assuming that touching the upper band means sell and touching the lower band means buy, which works in a range and fails badly in a trend. This guide explains the three setups that actually matter: the squeeze, the bounce and the breakout.
How Bollinger Bands are built
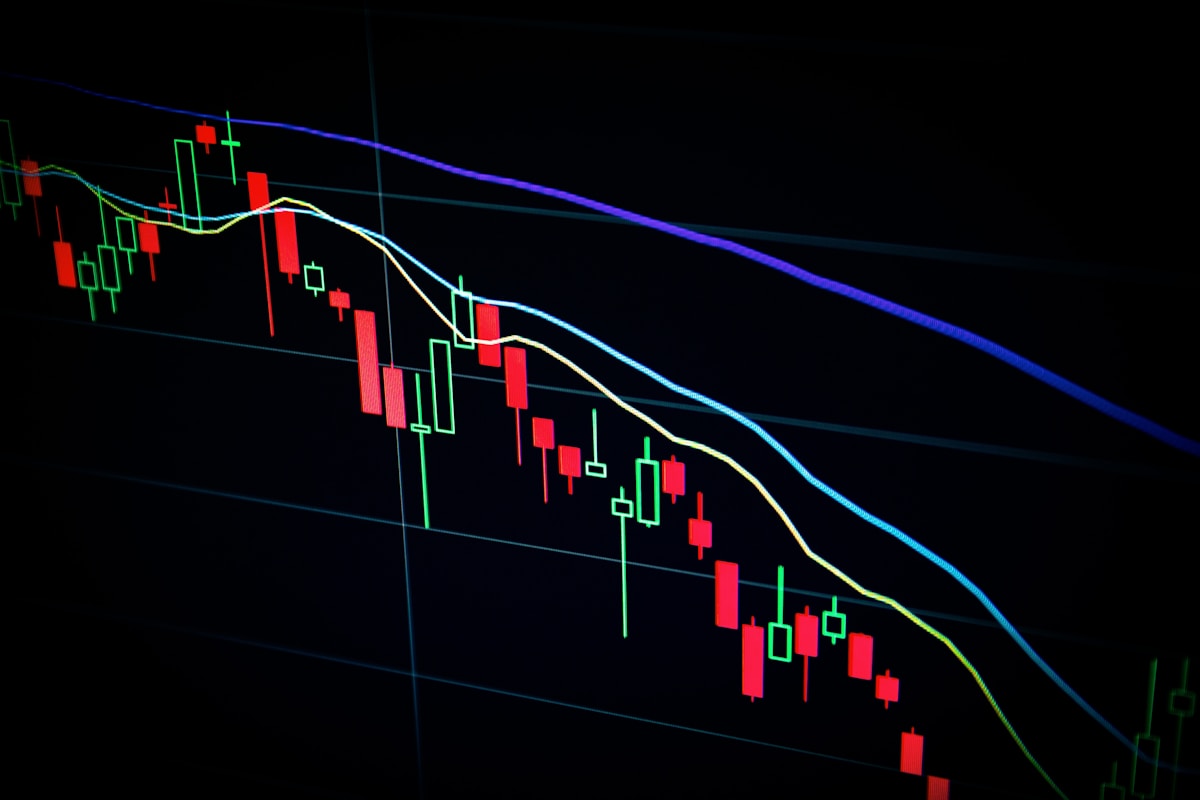
Bollinger Bands consist of three lines. The middle band is a simple moving average, usually 20 periods. The upper and lower bands are plotted two standard deviations above and below that average. Standard deviation is a measure of how far prices typically move from the average, so the bands widen when price swings are large and narrow when price is calm. Roughly speaking, most price action stays inside the bands, which is why a move outside them catches the eye. The default settings of 20 periods and two standard deviations suit most currency pairs and timeframes, and there is little reason for a beginner to change them.
The squeeze: calm before the storm
The squeeze happens when the bands contract tightly around price, which means volatility has dropped to a low level. Markets move in cycles, and long quiet periods are usually followed by sharp moves, so the squeeze is a warning that a big move is coming, not a prediction of its direction. Traders watch for the squeeze on daily and four-hour charts, then wait for price to break out of the range with a strong candle and expanding bands. The mistake is guessing the direction in advance. A squeeze can break either way, so the patient approach is to let price choose, then trade in the direction of the break with a stop below the range.
The bounce: trading the range
In a sideways market, price often bounces between the upper and lower bands like a ball between two walls. When the bands are flat and horizontal, a touch of the lower band followed by a bullish candlestick can be a reasonable long idea, and a touch of the upper band followed by a bearish candle can be a short idea. The key condition is that the market is genuinely ranging, which you can check by looking at the middle band: if it is flat, the market has no strong trend. If the middle band is sloping sharply, the market is trending, and band touches are more likely to be the start of a continuation than a reversal.
The breakout: when price walks the band
In a strong trend, price can ride along the upper or lower band for a long time, a pattern traders call walking the band. Beginners who sell every touch of the upper band in an uptrend get run over again and again, because in a trend the bands expand and price keeps pushing higher. The breakout setup works the other way: when price closes outside the band with momentum and the band starts expanding, it often marks the beginning of a strong move rather than the end of one. The practical rule is simple. In a range, fade the bands. In a trend, respect them, and use a close back inside the bands as the sign that the move may be losing steam.
Combining Bollinger Bands with other tools
Bollinger Bands work best with a second tool that answers the question they cannot: is this market trending or ranging? The RSI is a popular partner, because an overbought RSI reading near the upper band strengthens a bounce idea, while a neutral RSI near the band warns that the move may continue. Moving averages help too: if price is above a rising 50-period average, treat lower-band touches as buying opportunities and ignore upper-band sells. Volume or a volatility measure like the ATR can confirm breakouts. The principle is always the same: use the bands to measure volatility and extremes, and use something else to judge direction.
A practical Bollinger Bands routine
Start by marking whether the bands are contracting, flat or expanding, because that tells you which setup is in play. In a squeeze, set alerts above and below the range and trade the breakout. In a flat range, look for bounces with candlestick confirmation and keep targets near the opposite band. In a trend, use band touches only in the direction of the trend, with stops beyond the middle band. Whatever the setup, never risk more than one to two percent of your account on a single trade, and always place your stop where the idea is proven wrong, not where it feels comfortable. Bollinger Bands will not predict the market for you, but they will show you clearly when the market is quiet, stretched or breaking out, and that information is worth a great deal. Trading involves substantial risk of loss; never trade with money you cannot afford to lose.
More from 1UpTrade Live