How to Read Candlestick Patterns in Forex: A Beginner's Visual Guide

- Primary Signal: How to Read Candlestick Patterns in Forex: A Beginner's Visual Guide
- Overview: Candlesticks pack open, high, low and close into one picture. Learn to read single candles, spot reversal and continuation patterns, and avoid the classic beginner traps....
- Verification: Analyzed and compiled by 1UpTrade Live editorial monitoring desk.
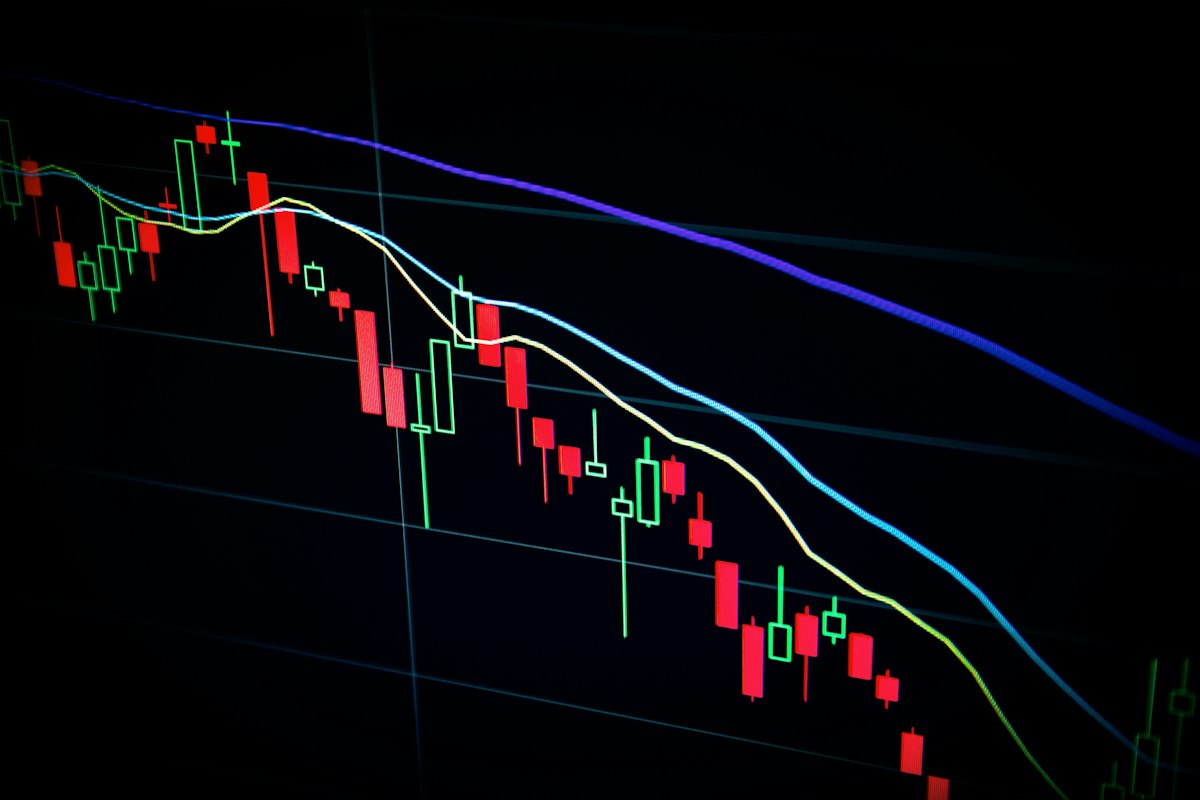
Every candlestick on a forex chart summarises one period of trading, whether that period is a minute, an hour or a day. The thick body shows where price opened and closed, while the thin wicks show the highest and lowest prices reached. A candle that closes higher than it opened is usually drawn in one colour, and a candle that closes lower in another, so a quick glance at a chart reveals who was winning — buyers or sellers — in each period. Zooming out to a higher timeframe before analysing candles helps you see whether a pattern is forming with the trend or against it, which changes its reliability considerably.
The length of the body and wicks adds detail. A long body means strong conviction in one direction, while a short body means buyers and sellers were evenly matched. A long upper wick shows price pushed higher but was rejected, and a long lower wick shows the opposite. Learning to read these shapes is like learning to read body language: one candle rarely tells the full story, but a sequence of candles reveals the market's mood. Volume, where available on your platform, adds useful confirmation, since a reversal pattern forming on rising participation carries more weight than one forming on thin activity.
Beginners should start with a handful of reversal patterns rather than memorising dozens. A hammer, with a small body and a long lower wick after a downtrend, suggests sellers tried to push lower but buyers stepped in. An engulfing pattern, where one candle's body fully covers the previous candle's body, signals a sharp shift in control. A shooting star at the top of an uptrend mirrors the hammer and warns that buyers are losing strength. Some traders keep a personal pattern diary with screenshots, which speeds up learning far more than passively reading about patterns without ever reviewing their own examples.
The crucial rule is context: a hammer in the middle of a sideways range means little, but the same hammer at a strong support level after a clear downtrend means much more. Always ask where the pattern appears, what the trend was before it, and whether volume or the next candle confirms the signal. A pattern without confirmation is just a shape; wait for the following candle to close in the expected direction before acting. A doji candle, with nearly identical open and close, deserves special attention at extremes because it often marks the moment when buyers and sellers reach a temporary standoff.
Continuation patterns tell you the trend is pausing rather than reversing. Small-bodied candles clustered in a tight range after a strong move often form a flag or a resting phase, and a breakout from that range usually continues the original trend. These patterns reward patience: traders who jump in during the pause often get shaken out, while traders who wait for the breakout get a cleaner entry with a clearer invalidation level. Combining candlestick signals with a simple trend filter, such as a moving average, removes many low-quality signals that appear when price is drifting sideways without direction.
The classic beginner trap is trading every pattern on every timeframe. A pattern on a one-minute chart carries far less weight than the same pattern on a daily chart, because short-term charts are full of noise. Another trap is ignoring the spread and the session: patterns that form during thin liquidity, such as late-night hours, often fail. Filter your patterns by timeframe, session and nearby support or resistance, and your hit rate will improve noticeably. New traders should practise spotting patterns on closed historical charts first, where there is no pressure to act, before trying to read live candles as they form in real time.
Build your skill gradually by marking up a few charts each day: circle the patterns you recognise, note whether they worked, and review them weekly. Over time you will develop a feel for which patterns suit your personality — some traders love fast reversals, others prefer calm continuations. Candlestick reading is a practical skill, not a magic code, and it works best when combined with trend awareness, sensible risk and a written plan. Remember that candlesticks describe what already happened, so they work best as confirmation of a trade idea formed from trend and levels, not as a standalone prediction machine.
📖 Continue Reading the Full Story
Continue reading this article on 1UpTrade Live.
⚡ Access Full Content NowMore from 1UpTrade Live