How to Backtest a Forex Strategy Manually: A Step-by-Step Beginner Guide

- Primary Signal: How to Backtest a Forex Strategy Manually: A Step-by-Step Beginner Guide
- Overview: How to backtest a forex strategy manually with a clear step-by-step method, so you can test any idea on historical charts before risking real money on it....
- Verification: Analyzed and compiled by 1UpTrade Live editorial monitoring desk.
Manual backtesting means testing a trading strategy on historical price charts by stepping through the past bar by bar, recording each trade your rules would have taken, and measuring the results. Unlike automated backtesting, which requires coding, manual backtesting needs only a charting platform and a spreadsheet, and it has a hidden benefit: you see how the strategy feels in real market conditions, including choppy periods, long losing streaks, and sudden news spikes. That experience builds confidence in a strategy — or reveals its weaknesses — before you risk any real money on it.
Backtesting matters because it replaces opinion with evidence. Many strategies sound excellent in theory but fail when applied consistently, because they depend on hindsight, unclear rules, or rare perfect setups. By testing on months of past data, you learn the strategy's approximate win rate, average win and loss, maximum losing streak, and whether it works in trends, ranges, or only one of the two. This evidence does not guarantee future profits, because markets change, but it stops you from trading an untested idea live and hoping for the best, which is one of the most expensive beginner mistakes.
The most important step happens before you look at a single chart: write your strategy rules so precisely that someone else could follow them without asking questions. Define your timeframe, pairs, session, entry trigger, stop loss placement, take profit method, and any filters, such as avoiding trades during major news or only trading in the direction of the higher timeframe trend. If a rule is vague — for example, buy when the market looks strong — you will unconsciously bend it during testing to make results look better, and the test will be worthless.
Also decide your testing parameters in advance: how many trades or months you will test, what risk per trade you will assume, and how you will handle spreads and costs. A practical beginner target is at least one hundred trades or six months of data, whichever comes first, on one pair and one timeframe, so the sample is large enough to mean something. Write all of this in a document or spreadsheet header before you begin, and do not change the rules halfway through because early results disappoint you. If the strategy needs changing, finish the test, note the idea, and test the new version separately.
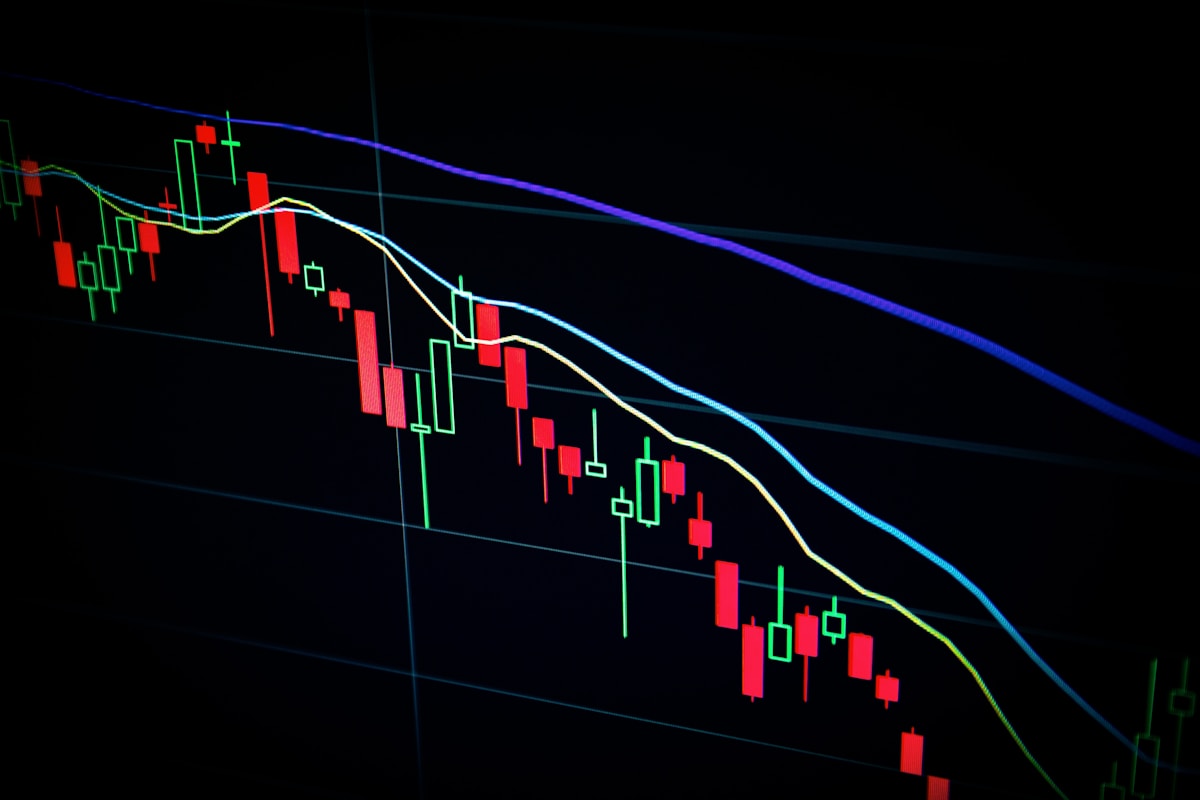
To test manually, hide the right side of your chart and move forward one candle at a time, or use your platform's replay feature if available. At each step, ask only what your rules say based on information available at that moment — never peek ahead to see whether the trade would have won. When your entry trigger appears, record the entry price, stop, target, date, and reason, then continue stepping forward until the stop or target is hit, or your exit rule triggers. Record the result honestly, including losses, and move on to the next setup without trying to fix a losing trade in hindsight.
This discipline is the hardest part, because hindsight makes past charts look obvious. A setup that looks perfect after the fact may have looked uncertain at the time, and counting it as a win when you would not have taken it live inflates your results. Keep a steady pace, take breaks to stay focused, and test in short sessions rather than marathon sittings that lead to careless recording. Over days or weeks, your spreadsheet will fill with real trades, and patterns will emerge: perhaps the strategy works beautifully in trends but bleeds slowly in ranges, which is valuable knowledge for deciding when to use it live.
Once you have your sample, calculate the basics: total trades, win rate, average win, average loss, largest win and loss, longest losing streak, and overall profit or loss in pips and in percentage terms at your planned risk. A strategy with a forty percent win rate can still be profitable if average wins are much larger than average losses, while a sixty percent win rate can still lose money if losses are huge — so never judge by win rate alone. Look at the equity curve of your test: steady growth with shallow pullbacks is healthier than a curve driven by one or two enormous wins, and long flat periods may mean the strategy only works in certain market conditions.
Use the results to make a calm decision. If the strategy is clearly unprofitable or has unbearable losing streaks, discard or revise it and test the new version from scratch. If it is modestly profitable with manageable drawdowns, move to demo trading for several weeks to confirm it works in live conditions, including spreads and real-time decision pressure. If demo confirms the backtest, you may consider small live size with strict risk rules. Manual backtesting will not predict the future, but it gives you something most beginners lack: a tested reason to trust your strategy, and a clear understanding of its strengths, weaknesses, and worst periods before real money is involved.
📖 Continue Reading the Full Story
Continue reading this article on 1UpTrade Live.
⚡ Access Full Content NowMore from 1UpTrade Live